#P14864. [ICPC 2020 Yokohama R] Three-Axis Views
[ICPC 2020 Yokohama R] Three-Axis Views
Problem Description
A friend of yours is an artist designing Image-Containing Projection Cubes (ICPCs). An ICPC is a crystal cube with its side of integer length. Some of its regions are made opaque through an elaborate laser machining process. Each of the opaque regions is a cube of unit size aligned with integer coordinates.
Figure A.1 depicts an ICPC as given in the Sample Input 1. Here, the green wires correspond to the edges of the crystal cube. The blue small cubes correspond to the cubic opaque regions inside the crystal.
:::align{center}
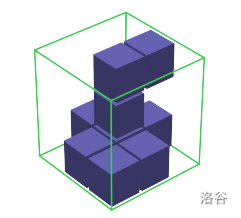
Figure A.1. ICPC of Sample Input 1 :::
ICPCs are meant to enjoy the silhouettes of its opaque regions projected by three parallel lights perpendicular to its faces. Figure A.2 depicts the ICPC and its three silhouettes.
:::align{center}
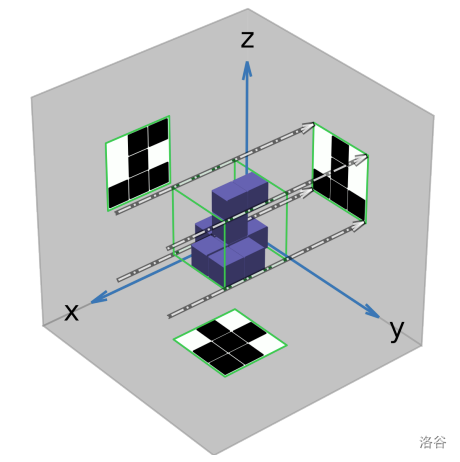
Figure A.2. ICPC of Sample Input 1 and its silhouettes (dashed-dotted lines are the edges of the parallel light perpendicular to the left face) :::
Your job is to write a program that decides whether there exists an ICPC that makes the given silhouettes.
Input Format
The input consists of a single test case of the following format.
Here, is the size of the ICPC, an integer between 1 and 100, inclusive.
The ICPC of size makes three silhouettes of squares of dark and bright cells. Cells are dark if they are covered by the shadows of opaque unit cubes, and are bright, otherwise. The lines, each with digits, starting from the second line of the input denote the three silhouettes of the ICPC, where ‘0’ represents a bright cell and ‘1’ represents a dark cell. At least one of the digits in the lines is ‘1’.
First comes the data for the silhouette on the -plane, where the first line gives the cells of the silhouettes with the largest -coordinate value. They are in the order of their -coordinates. The following lines, , give the cells with the decreasing values of their -coordinates.
Then comes the data for the silhouette on the -plane, where the first line, , gives the cells with the largest -coordinate value, in the order of their -coordinates. The following lines, , give the cells with the decreasing values of their -coordinates.
Finally comes the data for the silhouette on the -plane, where the first line, , gives the cells with the largest -coordinate value, in the order of their -coordinates. The following lines, , give the cells with the decreasing values of their -coordinates.
The following figure depicts the three silhouettes of the ICPC given in the Sample Input 1.
:::align{center}
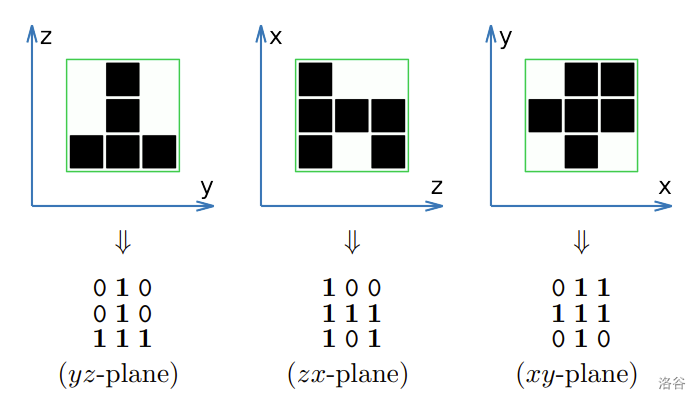
Figure A.3. 0-1 representations of silhouettes (Sample Input 1) :::
Output Format
Print “Yes” if it is possible to make an ICPC with the given silhouettes. Print “No”, otherwise.
3
010
010
111
100
111
101
011
111
010
Yes
2
00
01
00
10
10
00
Yes
2
00
00
00
10
10
00
No
2
01
00
00
10
10
00
No